biclosed

biclosed#

The free biclosed monoidal category, i.e. with left and right exponentials.

Summary#

Wire

A biclosed object is a self-dagger monoidal.Wire, i.e. its left and right colours always match.

Ty

A biclosed type is a monoidal type that can be exponentiated.

Exp

A base type to an exponent type, called with **.

Over

An exponent type over a base type, called with <<.

Under

A base type under an exponent type, called with >>.

Diagram

A biclosed diagram is a monoidal diagram with Curry and Eval boxes.

Box

A biclosed box is a monoidal box in a biclosed diagram.

Eval

The evaluation of an exponential type.

Coeval

The coevaluation of an exponential type, i.e. the dagger of Eval.

Curry

The currying of a biclosed diagram.

Sum

A biclosed sum is a monoidal sum and a biclosed box.

Functor

A biclosed functor is a monoidal functor that preserves evaluation and currying.

CMap

alias of CMap[Diagram]

TermBase

A term in the internal language of biclosed categories.

Constant

A constant term of defined by a Diagram with dom=X, cod=Y.

Variable

A variable with a string as name and a Ty.

Application

The application either func(args) of a term func of type Y << X to a term args of type X or args(func, left=True) of a term args of type X fed as input to a term func of type X >> Y.

Abstraction

Axioms#

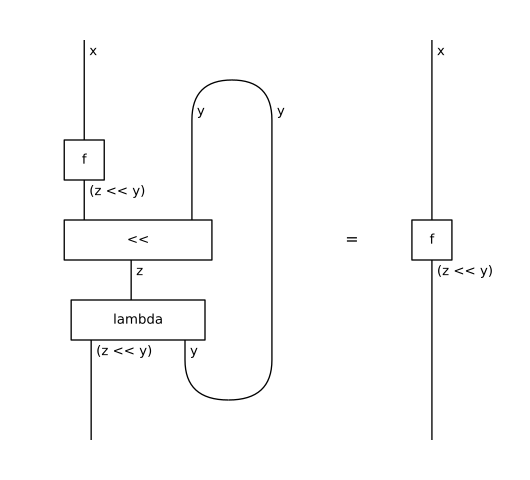
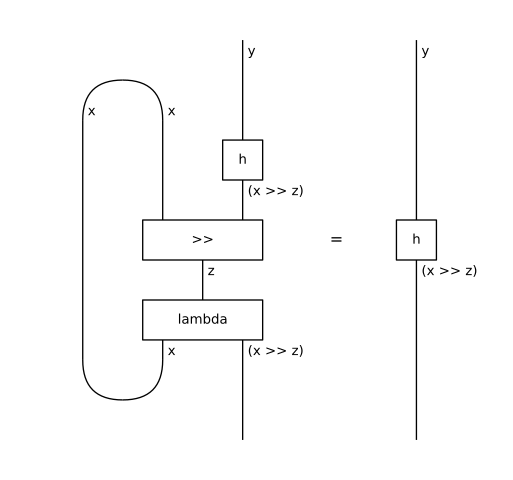
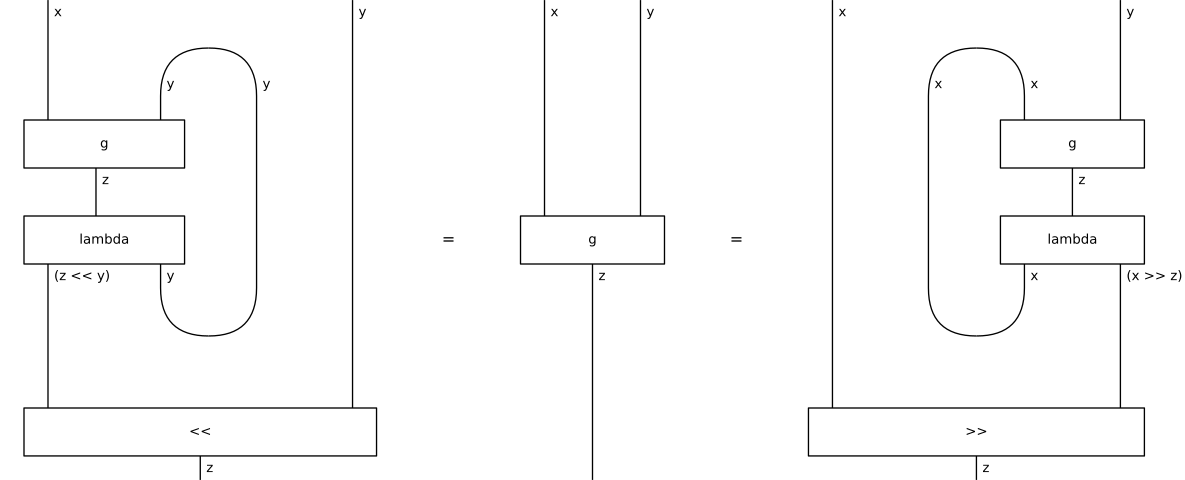
Diagram.curry() and Diagram.uncurry() are inverses.

>>> x, y, z = map(Ty, "xyz")
>>> f, g, h = Box('f', x, z << y), Box('g', x @ y, z), Box('h', y, x >> z)
>>> Equation(f.uncurry(left=True).curry(left=True), f).draw(
...     doctest='docs/_static/biclosed/curry-left.svg', margins=(0.1, 0.05))
../_images/curry-left.svg
>>> Equation(h.uncurry(left=False).curry(left=False), h).draw(
...     doctest='docs/_static/biclosed/curry-right.svg', margins=(0.1, 0.05))
../_images/curry-right.svg
>>> Equation(
...     g.curry(left=True).uncurry(left=True), g,
...     g.curry(left=False).uncurry(left=False)).draw(
...         doctest='docs/_static/biclosed/uncurry.svg')
../_images/uncurry.svg

Compact currying#

Diagram.to_compact() bends curry bubbles into coevaluation and feedback, which lands in CMap as a biclosed category has no trace.

>>> g.curry(left=True).uncurry(left=True).to_compact().draw(show=False,
...     doctest="docs/_static/cmap/biclosed-curry-left.dot")

graph cmap { graph [bgcolor="white", fontname="DejaVu Sans", layout="dot", margin="0.04", outputorder="edgesfirst", overlap="false", rankdir="TB", splines="true"]; node [color="black", fontname="DejaVu Sans", fontsize="12", margin="0", shape="plain"]; edge [color="black", fontname="DejaVu Sans", fontsize="9", headclip="true", penwidth="1.4", tailclip="true"]; v0 [label=<<TABLE BORDER="0" CELLBORDER="0" CELLSPACING="0"><TR><TD PORT="p2" TOOLTIP="dom 0: x (up)" BORDER="0" CELLPADDING="0" COLSPAN="1" WIDTH="18" HEIGHT="0"></TD><TD PORT="p3" TOOLTIP="dom 1: y (up)" BORDER="0" CELLPADDING="0" COLSPAN="1" WIDTH="18" HEIGHT="0"></TD></TR><TR><TD BORDER="1" CELLPADDING="6" COLSPAN="2" WIDTH="36">g</TD></TR><TR><TD PORT="p4" TOOLTIP="cod 0: z (down)" BORDER="0" CELLPADDING="0" COLSPAN="2" WIDTH="36" HEIGHT="0"></TD></TR></TABLE>>]; v1 [label=<<TABLE BORDER="0" CELLBORDER="0" CELLSPACING="0"><TR><TD PORT="p5" TOOLTIP="dom 0: z (up)" BORDER="0" CELLPADDING="0" COLSPAN="2" WIDTH="36" HEIGHT="0"></TD></TR><TR><TD BORDER="1" CELLPADDING="6" COLSPAN="2" WIDTH="36">lambda</TD></TR><TR><TD PORT="p7" TOOLTIP="cod 0: (z &lt;&lt; y) (down)" BORDER="0" CELLPADDING="0" COLSPAN="1" WIDTH="18" HEIGHT="0"></TD><TD PORT="p6" TOOLTIP="cod 1: y (down)" BORDER="0" CELLPADDING="0" COLSPAN="1" WIDTH="18" HEIGHT="0"></TD></TR></TABLE>>]; v2 [label=<<TABLE BORDER="0" CELLBORDER="0" CELLSPACING="0"><TR><TD PORT="p8" TOOLTIP="dom 0: (z &lt;&lt; y) (up)" BORDER="0" CELLPADDING="0" COLSPAN="1" WIDTH="18" HEIGHT="0"></TD><TD PORT="p9" TOOLTIP="dom 1: y (up)" BORDER="0" CELLPADDING="0" COLSPAN="1" WIDTH="18" HEIGHT="0"></TD></TR><TR><TD BORDER="1" CELLPADDING="6" COLSPAN="2" WIDTH="36">&lt;&lt;</TD></TR><TR><TD PORT="p10" TOOLTIP="cod 0: z (down)" BORDER="0" CELLPADDING="0" COLSPAN="2" WIDTH="36" HEIGHT="0"></TD></TR></TABLE>>]; input [label=<<TABLE BORDER="0" CELLBORDER="0" CELLSPACING="0"><TR><TD PORT="p0" TOOLTIP="input 0: x" BORDER="0" CELLPADDING="4"></TD><TD PORT="p1" TOOLTIP="input 1: y" BORDER="0" CELLPADDING="4"></TD></TR></TABLE>>]; output [label=<<TABLE BORDER="0" CELLBORDER="0" CELLSPACING="0"><TR><TD PORT="p11" TOOLTIP="output 0: z" BORDER="0" CELLPADDING="4"></TD></TR></TABLE>>]; { rank=min; input; } { rank=max; output; } input:p0:s -- v0:p2:n [label="x", labeldistance="1.6", len="0.85"]; input:p1:s -- v2:p9:n [label="y", labeldistance="1.6", len="0.85"]; v0:p3:n -- v1:p6:s [label="y", labeldistance="1.6", len="0.85"]; v0:p4:s -- v1:p5:n [label="z", labeldistance="1.6", len="0.85"]; v1:p7:s -- v2:p8:n [label="(z << y)", labeldistance="1.6", len="0.85"]; v2:p10:s -- output:p11:n [label="z", labeldistance="1.6", len="0.85"]; }

>>> g.curry(left=False).uncurry(left=False).to_compact().draw(show=False,
...     doctest="docs/_static/cmap/biclosed-curry-right.dot")

graph cmap { graph [bgcolor="white", fontname="DejaVu Sans", layout="dot", margin="0.04", outputorder="edgesfirst", overlap="false", rankdir="TB", splines="true"]; node [color="black", fontname="DejaVu Sans", fontsize="12", margin="0", shape="plain"]; edge [color="black", fontname="DejaVu Sans", fontsize="9", headclip="true", penwidth="1.4", tailclip="true"]; v0 [label=<<TABLE BORDER="0" CELLBORDER="0" CELLSPACING="0"><TR><TD PORT="p2" TOOLTIP="dom 0: x (up)" BORDER="0" CELLPADDING="0" COLSPAN="1" WIDTH="18" HEIGHT="0"></TD><TD PORT="p3" TOOLTIP="dom 1: y (up)" BORDER="0" CELLPADDING="0" COLSPAN="1" WIDTH="18" HEIGHT="0"></TD></TR><TR><TD BORDER="1" CELLPADDING="6" COLSPAN="2" WIDTH="36">g</TD></TR><TR><TD PORT="p4" TOOLTIP="cod 0: z (down)" BORDER="0" CELLPADDING="0" COLSPAN="2" WIDTH="36" HEIGHT="0"></TD></TR></TABLE>>]; v1 [label=<<TABLE BORDER="0" CELLBORDER="0" CELLSPACING="0"><TR><TD PORT="p5" TOOLTIP="dom 0: z (up)" BORDER="0" CELLPADDING="0" COLSPAN="2" WIDTH="36" HEIGHT="0"></TD></TR><TR><TD BORDER="1" CELLPADDING="6" COLSPAN="2" WIDTH="36">lambda</TD></TR><TR><TD PORT="p7" TOOLTIP="cod 0: x (down)" BORDER="0" CELLPADDING="0" COLSPAN="1" WIDTH="18" HEIGHT="0"></TD><TD PORT="p6" TOOLTIP="cod 1: (x &gt;&gt; z) (down)" BORDER="0" CELLPADDING="0" COLSPAN="1" WIDTH="18" HEIGHT="0"></TD></TR></TABLE>>]; v2 [label=<<TABLE BORDER="0" CELLBORDER="0" CELLSPACING="0"><TR><TD PORT="p8" TOOLTIP="dom 0: x (up)" BORDER="0" CELLPADDING="0" COLSPAN="1" WIDTH="18" HEIGHT="0"></TD><TD PORT="p9" TOOLTIP="dom 1: (x &gt;&gt; z) (up)" BORDER="0" CELLPADDING="0" COLSPAN="1" WIDTH="18" HEIGHT="0"></TD></TR><TR><TD BORDER="1" CELLPADDING="6" COLSPAN="2" WIDTH="36">&gt;&gt;</TD></TR><TR><TD PORT="p10" TOOLTIP="cod 0: z (down)" BORDER="0" CELLPADDING="0" COLSPAN="2" WIDTH="36" HEIGHT="0"></TD></TR></TABLE>>]; input [label=<<TABLE BORDER="0" CELLBORDER="0" CELLSPACING="0"><TR><TD PORT="p0" TOOLTIP="input 0: x" BORDER="0" CELLPADDING="4"></TD><TD PORT="p1" TOOLTIP="input 1: y" BORDER="0" CELLPADDING="4"></TD></TR></TABLE>>]; output [label=<<TABLE BORDER="0" CELLBORDER="0" CELLSPACING="0"><TR><TD PORT="p11" TOOLTIP="output 0: z" BORDER="0" CELLPADDING="4"></TD></TR></TABLE>>]; { rank=min; input; } { rank=max; output; } input:p0:s -- v2:p8:n [label="x", labeldistance="1.6", len="0.85"]; input:p1:s -- v0:p3:n [label="y", labeldistance="1.6", len="0.85"]; v0:p2:n -- v1:p7:s [label="x", labeldistance="1.6", len="0.85"]; v0:p4:s -- v1:p5:n [label="z", labeldistance="1.6", len="0.85"]; v1:p6:s -- v2:p9:n [label="(x >> z)", labeldistance="1.6", len="0.85"]; v2:p10:s -- output:p11:n [label="z", labeldistance="1.6", len="0.85"]; }